3. Add Signal Route
Next step is to configure the Router at https://localhost:5050/Routes.
Add Route
Add a new Route by clicking + ADD ROUTE on the top of the page. In the pop-up, enter a descriptive Name and click ADD ROUTE.
A new Route appears and is enabled by default.
Add Source
Add a new Source by clicking the + ADD SOURCE button.
Select the Target added in the previous step and select the Signals you want to be read in the dropdown.
Add Destination
Add a new Destination by clicking the + ADD DESTINATION button.
Select Data Lake, click ADD DESTINATION and submit the changes by clicking Save on the bottom right of the page.
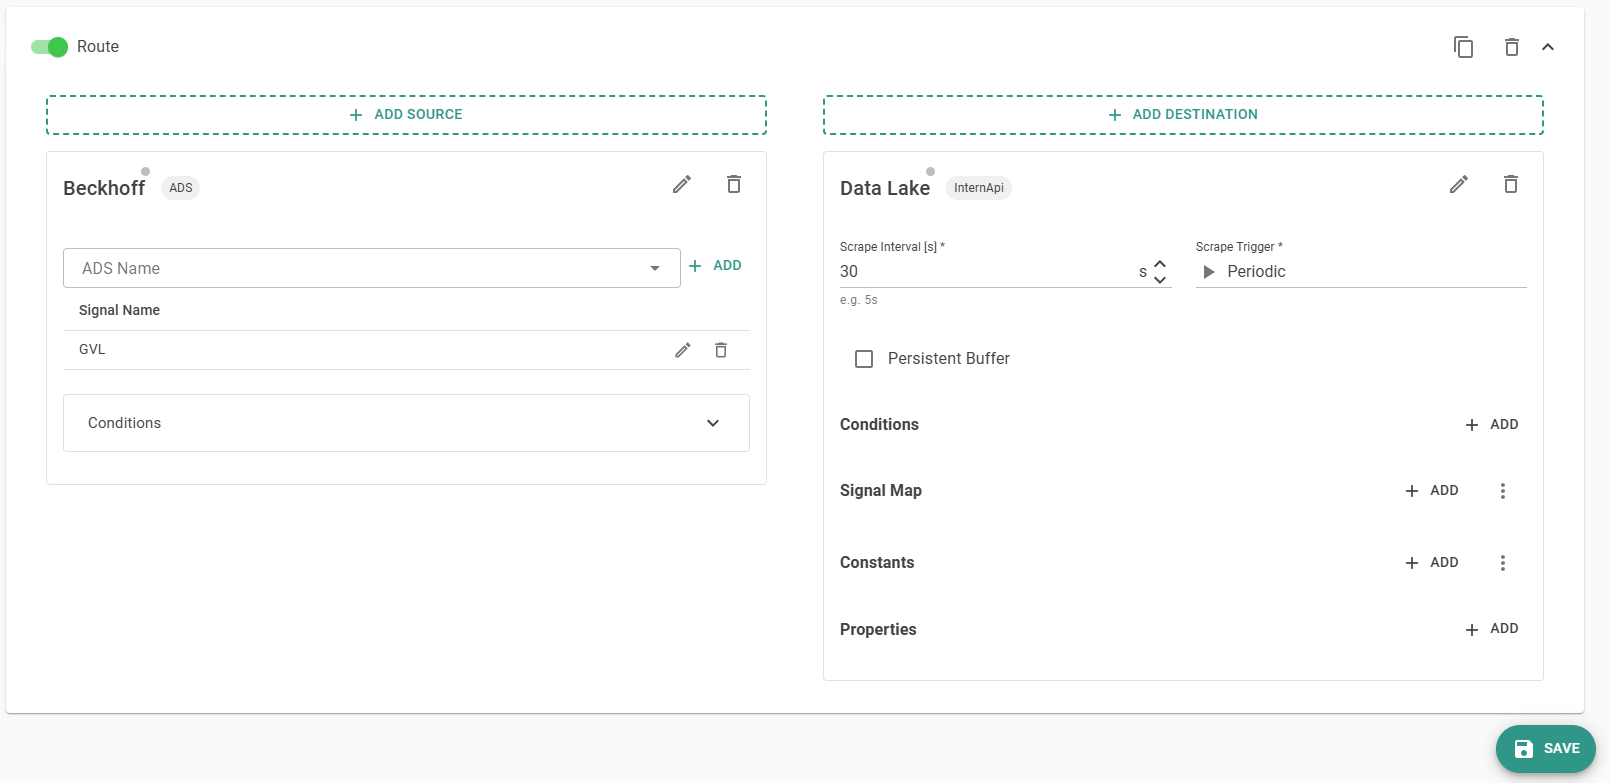
Now, the signals get read every 30s and are stored in the Data Lake.
The period to read signals can be set at the Destination section. However, this will not influence the speed to store the data in the Data Lake.
This can be set on the Settings page with the Scrape Interval parameter at the Insights Collector.
Be careful setting this value too low if the Monitoring service is enabled as it also influences the scrape time of all monitoring signals.