Introduction
Let's discover the hopit Platform in less than 5 minutes.
Platform Overview
The hopit Platform is a complete IIoT solution, to manage and operate distributed automation machinery. It connects all machines to a central cloud core and enables Managers, Data-Scientists and Developers to run their machine fleet.
Modern automation systems are based on PC-based control technology, utilizing Industrial PCs with modern operating systems like Windows or Linux. To successfully operate these machines at scale, two main problems have to be solved:
- remotely service all IPCs with software updates and maintenance tasks
- monitor the machine state to guarantee up-time and analyze performance.
The hopit platform solves these tasks with hopit. Operate and hopit. Stream from a feature perspective.
Hopit's two main software components are hopit. Edge representing the shopfloor devices and hopit. Portal as the central cloud core component to manage the Edge devices.
hopit. Operate
Hopit Operate is mainly responsible for operating and servicing the hopit Edge devices starting with automatically setting up all necessary software components (provisioning). Furthermore, it includes a fully integrated CI/CD pipeline for version control, testing and packaging your automation software, finishing with the deployment of these software packages and other maintenance tasks at scale.
Provisioning
The first setup of a brand-new Industrial PC is called provisioning. Take advantage of hopit's single click provisioning service for Beckhoff IPCs and setup multiple IPCs at once. The following steps are automatically triggered with hopit's provisioning feature
- install the hopit Edge software with individual settings like connection keys and device certificates
- update their operating system with security updates
- install your TwinCAT PLC software with the correct runtime version (Beckhoff XAR)
- installs necessary drivers
- configures the network interfaces
- setup a save user environment or
- configures the autostart behavior of HMI's.
Just a single click is necessary to automatically connect your Industrial PC to the hopit Platform for managing all devices.
DevOps
DevOps is an abbreviation for Development & Operations and is the standard workflow to develop robust and high quality software. Use the integrated and private GitLab instance for version control and a CI/CD pipeline. This pipeline automatically builds the software on a cloud server, checks for errors with python based Unit-Tests and generates a dedicated package on new releases which can be deployed to the Edge devices later.
Deployment
Once a package is released in the store, it can be deployed to the Edge devices. The roll-out can be controlled using the hopit Portal and can perform deployments on single devices or groups of devices.
Device Twin
For managing Edge devices, each device synchronizes a Device Twin of the configuration to the hopit Portal or any other compatible cloud platform like Azure IoT Hub. Every single setting of the Edge software can be controlled via its Device Twin. This way, scalable deployments and configuration roll-outs can be realized.
hopit. Stream
Hopit Stream enables you to stream data from hopit Edge Devices either to the hopit Portal, storing it in a centralized time-series database, or to any other MQTT compatible platform like for example Microsoft Azure IoT Hub. Visualize and analyze your timeseries data in a central dashboard or further integrate your data with our API.
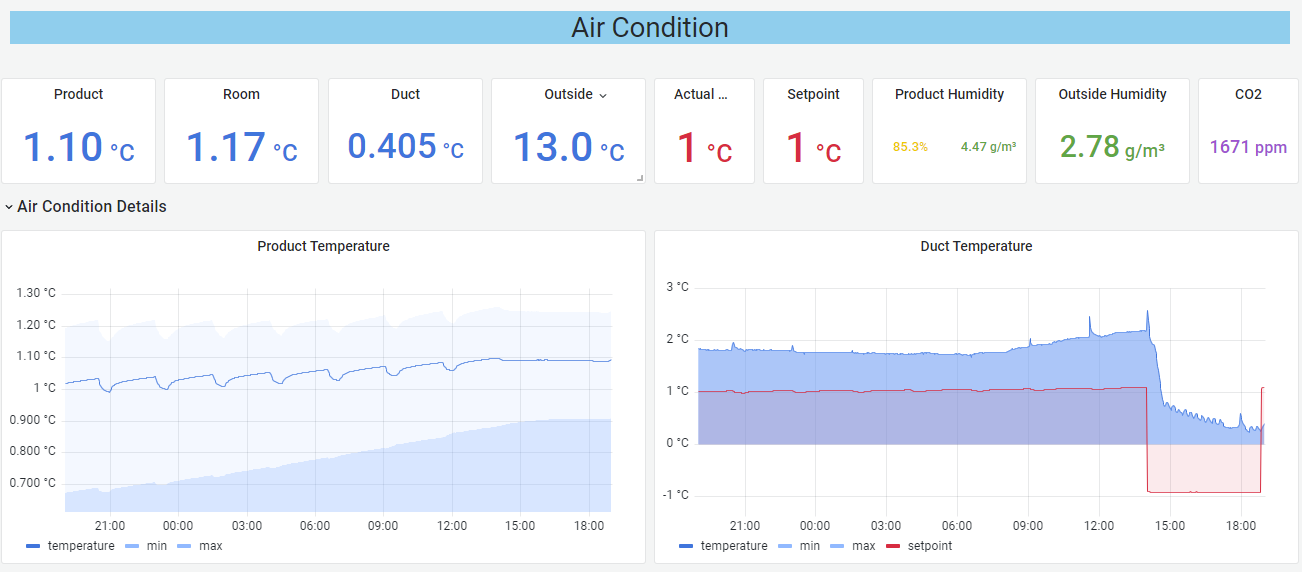
Targets
Data can be accessed from external devices via different protocols like ADS (Beckhoff), OPC UA, S7 (Siemens), Azure IoT Hub etc. with hopit Edge and can be routed between the targets and/or to the hopit. Platform. Many features like namespace discovery, buffering, name mapping, conditional routing, adding constants, offline storage & dashboard, ... are available.
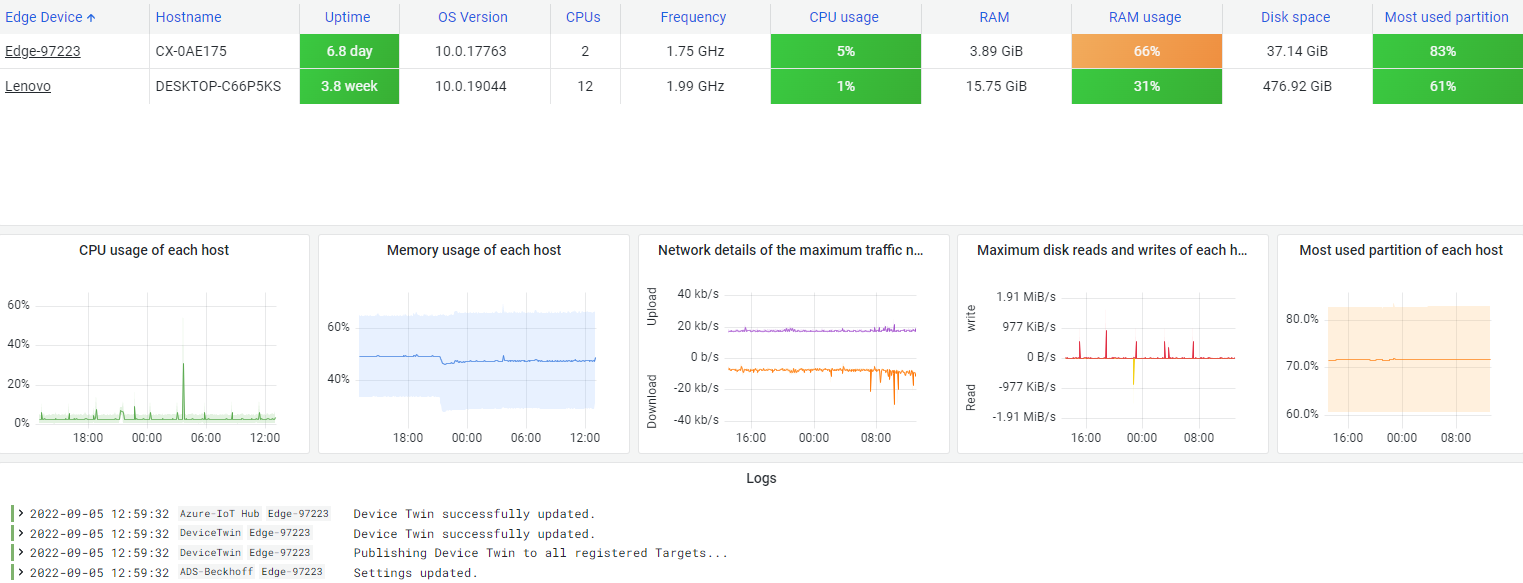
Monitoring
The inbuilt system monitor in the hopit Edge continuously monitors system resources like CPU load, RAM and storage utilization, network usage and many more. Additionally, all these parameters can be monitored for individual processes and services. Also the state of the Edge software itself including the logs and the connection to all targets are monitored.
Alerting
On each variable (or combinations of variables) collected from Targets or the Monitor, a query can be applied to check if it is in a safe state. If not, alert messages are fired and e-mails or push notifications are sent.