4. Add Dashboard
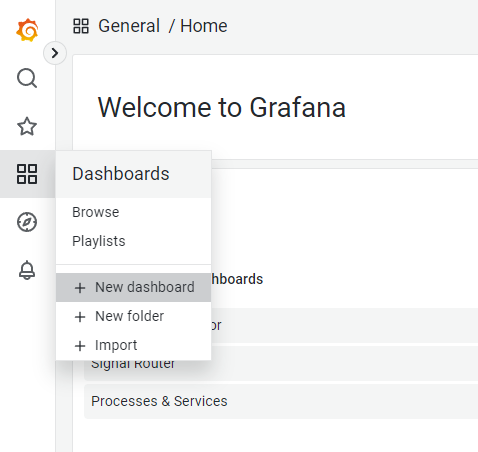
To create a dashboard to show the signals, click on Dashboards -> More ... in hopit Edge. This opens the Grafana interface.
Here, click the New dasbboard button.
Click the Add a new panel option and select the signal configured in the previous step.
It can take one or two minutes until it is present in this list.
The Signals here are all lower case and any special character is replaced by an underscore.
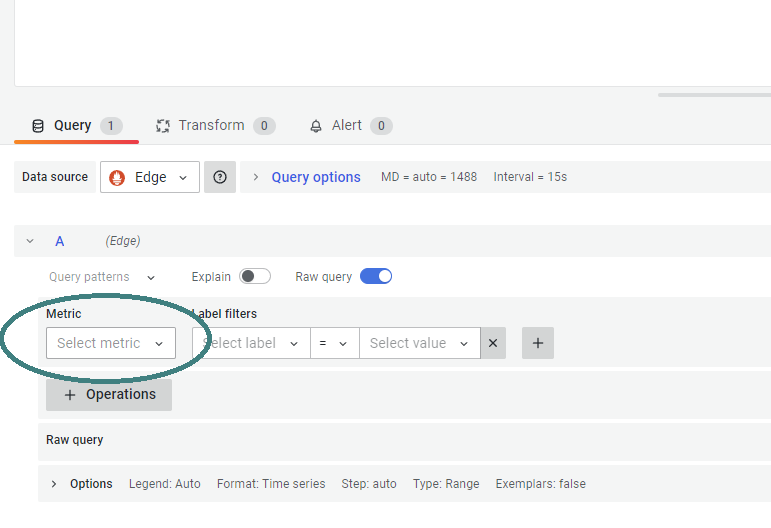
Array indices are removed and can be selected using the Label filter. Grafana Variables can be used to select array indices for the whole dashboard. Please read the Grafana documentation.
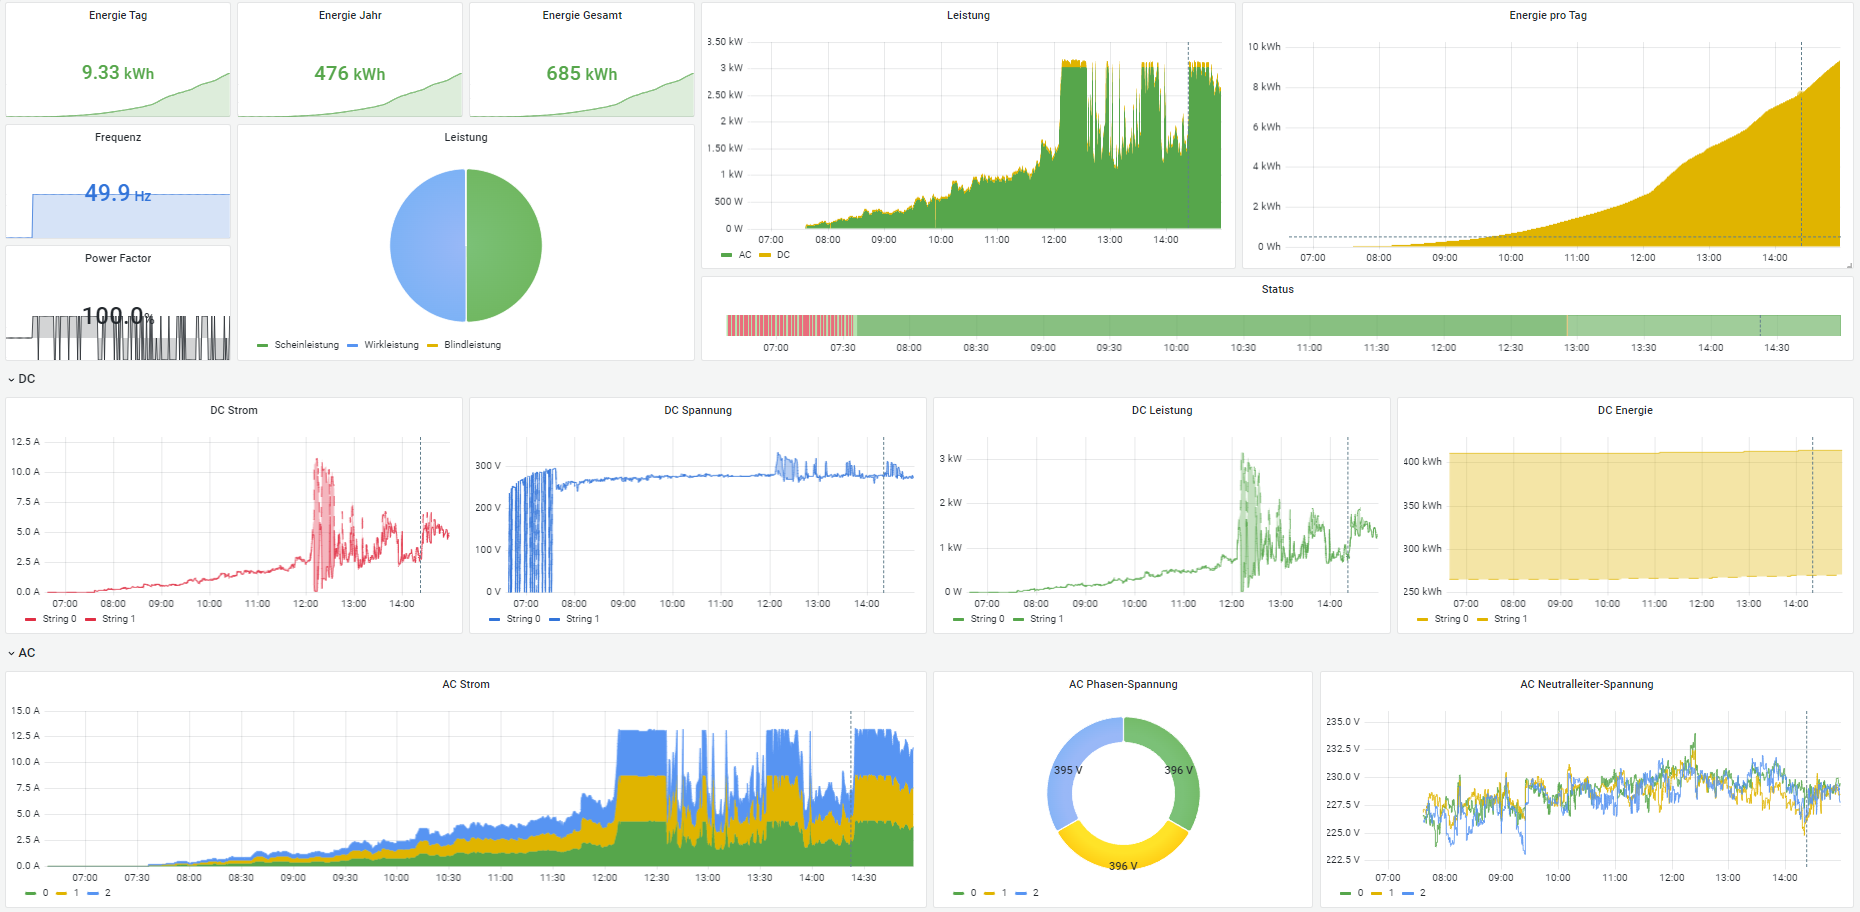
Design your customized dashboard with your signals for your specific application.
To use the Data Lakes in the hopit Portal, you can use DataLake-short-term or DataLake-long-term as Destination in the Router.
Then a central dashboard for all connected Edge Devices can be created.
Information about reading-times and up-times can be seen in hopit Edge at Dashboards -> Router. For this the System Monitor service must be enabled.