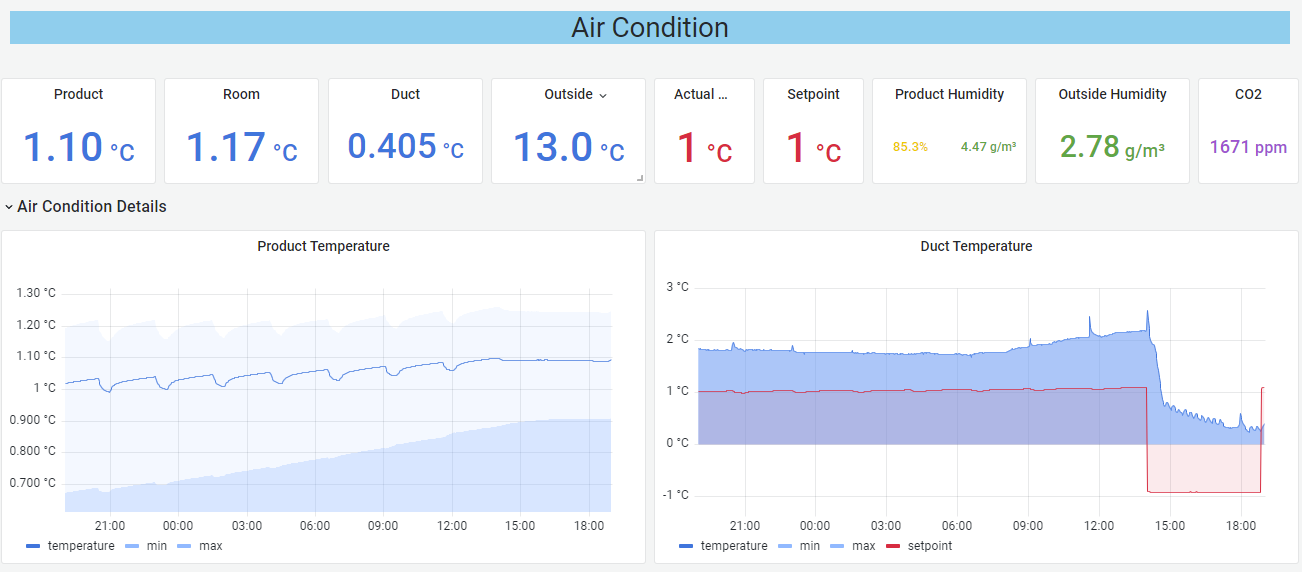
Dashboard
To display time series data, Grafana is used as dashboard provider. The data can be requested using the PromQL query language.
For Information how to send data to the Data Lakes, please read the Insights Collector documentation. For details on the naming and labeling of signals, see the Data Lake documentation. For detail how to design dashboards, visit the Grafana documentation.
Edge Dashboard
The Edge Dashboard is is located on the Edge device at https://localhost:5050/dashboards.
It is automatically enabled when starting the Edge Data Lake.
Portal Dashboard
The Portal Dashboard is located at https://metrics.<server>.hopit.at.
Be sure to select the right Data source when adding a Panel (hopit long-term or hopit short-term). To view Logs, use the hopit logs data source.
Data from different Edge devices can be distinguished using the instance label, which has the Edge DeviceName parameter as value (see Insights Collector).
Example
