Alerting
Alerting services are available in the hopit Edge service and in the hopit Portal. E-Mail alerting on Data Lake level or Grafana alerting on Dashboard level is available respectively. Complex alerting queries can be added based on the data in the Edge Data Lake or based on the Data Lake in the hopit Portal.
hopit Edge Alerting
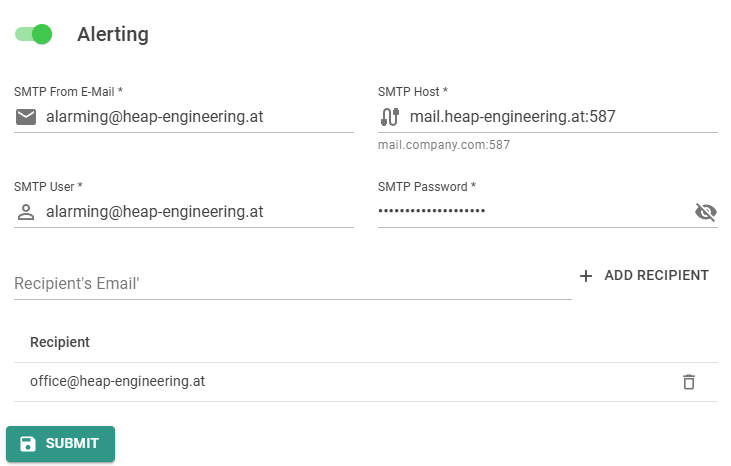
Hopit Edge Alerting can be enabled and configured in the Edge settings:
Corresponding Edge configuration and Device Twin definition to activate the Edge Alerting service:
- Edge-UI
- Device Twin
{
  "Alerting": {
      "SmtpFromMail": "<EMAIL>",
      "SmtpUser": "<USER>",
      "SmtpPassword": "<PASSWORD>",
      "SmtpHost": "<HOST>:<Port>",
      "Recipients": [
          "office@heap-engineering.at"
      ],
      "Enabled": true
  }
}
The alerting rules are hard coded and includes:
- Service down (for all running services like VPN, Data Lake, ...)
- Windows Service down (hopit. Edge service, TwinCAT services and the VPN service)
- CPU usage higher than
70%for more than2m - Memory usage higher than
70%for more than2m - Remaining Disk space lower than
10% - System rebooted
hopit Portal Alerting
The Alerting service in the Portal is hard-coded. Please contact HEAP Engineering GmbH for changes.
Grafana Edge Alerting
For Grafana Edge alerting, open https://localhost:5050/dashboards on the Edge. To use E-Mail alerting in Grafana, the Alerting service must be enabled and valid SMTP settings configured. For a documentation, see the Grafana docs.
Grafana Portal Alerting
For Grafana Portal alerting, open https://metrics.<server>.hopit.at. For a documentation, see the Grafana docs.