4. Add Alerting
Configure Contact Point
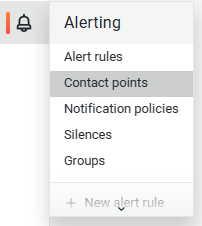
Now go to https://localhost:5050/dashboards and navigate to the Contact points settings.
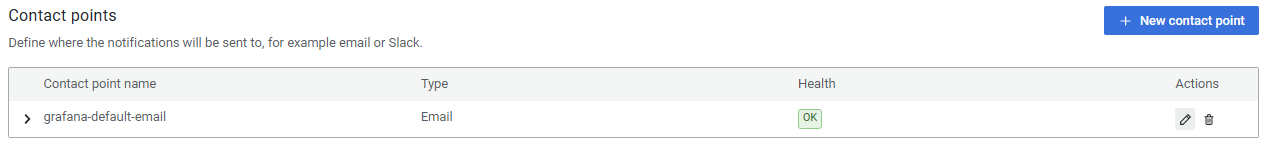
Click on the Edit button in the Actions column of the grafana-default-email row.
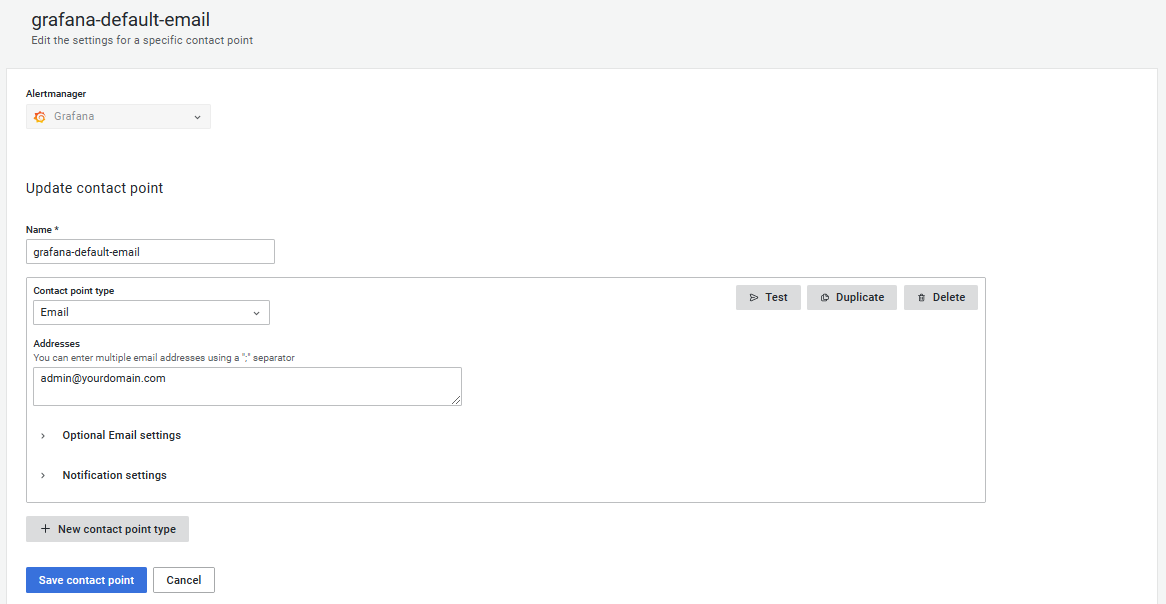
Enter one or more Email addresses separated by ; in the Addresses field and click the Save contact point button.
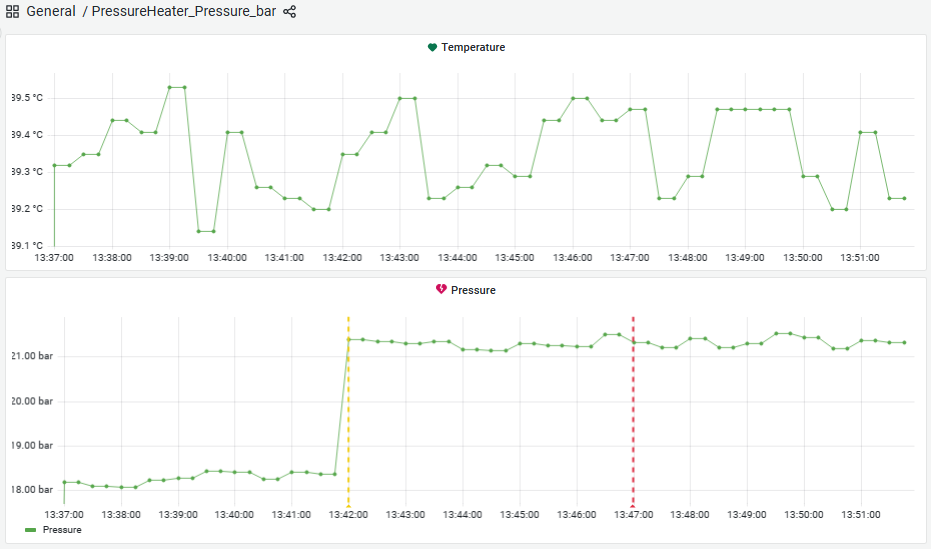
Create Dashboard
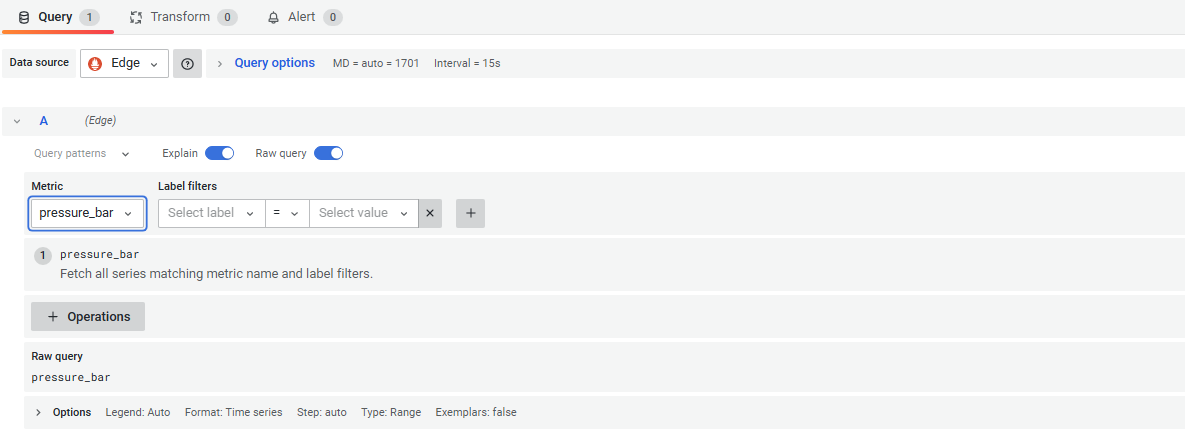
Add a New dashboard and click on Add new Panel.

Select the before configured variable in the Metric dropdown and save the dashboard.
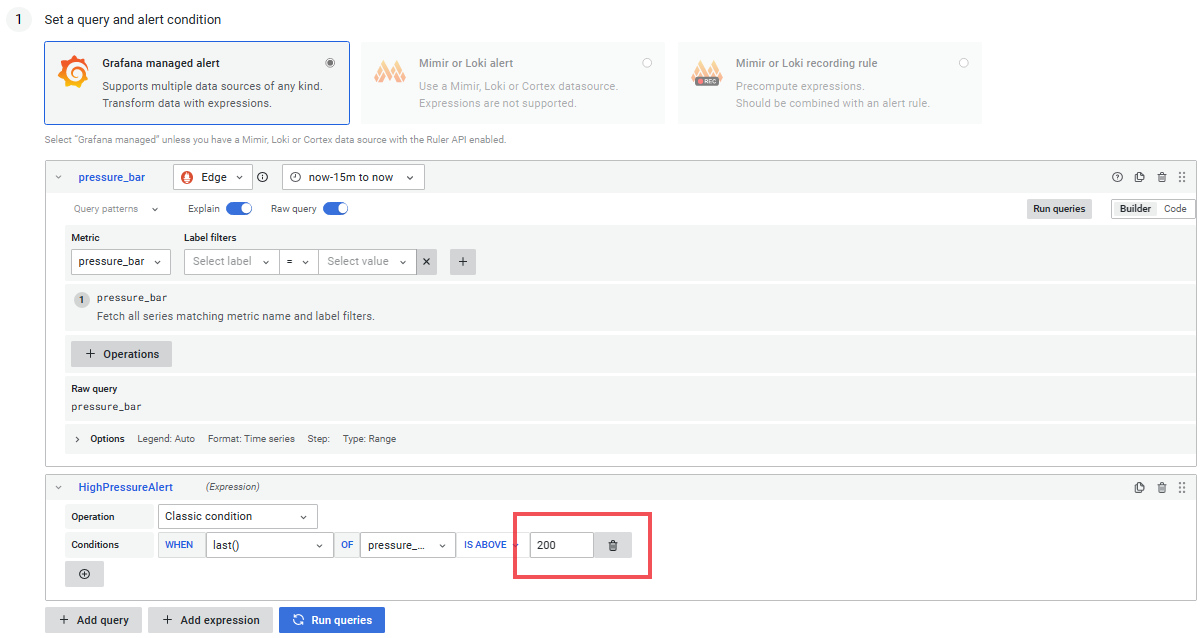
Configure Alerts
Now change to the Alert tab and click on Create alert rule from this panel.

Here you can configure a threshold which the signal should not exceed. If however the threshold is surpassed, an alert will be sent to the before configured email addresses.
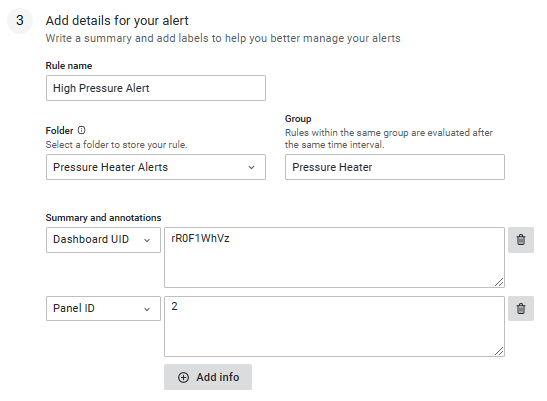
Also the rule needs to be assigned to a folder and a group in section 3. To create a new folder click on Add new in the dropdown, write a name into the field and press Enter.
After the rule and the dashboard are saved you will now receive an email alert if the set threshold is exceeded.
| Dashboard | Alert Message |
|---|---|
 | 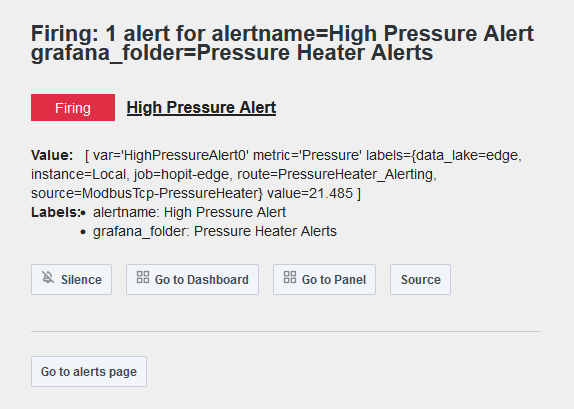 |